Number crunching isn’t something associated with football, but it might be the thing that makes the difference between winning and losing in the future.
In this world of big data, where bucketsful of information is available, making the right decisions based on statistics gives companies the edge in business. This is the basic reason for the existence of so many management consultants advising companies on what to do based on data. If you make the right inference from data, you are more likely to succeed than others who are not privy to that knowledge. Football is no different. Or so it would seem.
Football is a passionate game, where heart and adrenaline rule the roost more than logic and science. Where gut is given more weight than statistical decisions. A football manager is typically an ex-player who has vast experience in the way the game was played, “knows” the game well and makes decisions based on his instincts. However, football is now at the beginning of a statistical revolution where managers will rely more on the numbers to assist their decisions.
One of the earliest famous examples of data helping make footballing decisions was at the 2006 World Cup quarter-final in Berlin where Argentina and Germany were going head to head in the penalty shoot-out. German goalkeeping coach Andreas Kopke had given keeper Jens Lehmann a sheet of paper on which it was written down where 7 Argentinian players were likely to put their penalty kicks. Lehmann had that sheet with him during the shoot-out and consulted it as the penalties were being taken. The sheet looked something like this:
Riquelme – left
Crespo – long run up/right; short run up/left
Heinze – left low
Ayala – 2 (shirt number) waits long time, long run up, right
Messi – left
Aimar – 16, waits long time, left
Rodriguez – 18, left
Of the 7 Argentinians on the list, two actually took the penalties. Ayala’s penalty was struck as described in the note, as he waited, made his long run up and struck it to his right. Lehmann duly dived to his left to save. Rodriguez too struck his penalty exactly as the note said, striking it too perfectly to the left corner of the goal for Lehmann to save. But, the cheat sheet had one final use in the shootout. When Esteban Cambiasso stepped up to take the crucial game saving penalty for Argentina, Lehmann once again took out the sheet from under his socks but found Cambiasso’s name missing from the list. However, he did enough to psyche the Argentine out, who wondered what Lehmann knew about his technique. Maybe it ruffled Cambiasso, maybe it didn’t but Lehmann saved and Germany won the match.
Another telling example that displays the use of statistics in a penalty shoot-out was in the Champions League final of 2008 between Manchester United and Chelsea. Weeks before the game, a professor of economics at an Israeli university, who knew a student, Ignacio Palacios-Huerta, who had done research on game theory and its relationship with penalties, introduced him to Chelsea manager Avram Grant. It so happened that Ignacio had studied Manchester United’s players for the penalty shootout and given the following advice to the Chelsea players:
1) Van der Sar dived to the kicker’s natural side more often than not. This meant that for a right footed kicker whose natural side is the left side of the goal, Van der Sar would dive to his right more often. Chelsea’s players were asked to try and score to their unnatural side during penalties. They were also told to strike the ball either high up or low, since Van der Sar saved the majority of spot kicks in between the heights of 1 to 1.5 metres.
2) Cristiano Ronaldo often stops in the run-up to the ball and whenever he does that, 85% of the times he strikes the ball to his natural side, which means to the right of the keeper. He also has the ability to change the direction of the penalty kick at the last moment when he stutters at the ball. If at the stutter, the keeper starts to dive in one direction, Ronaldo puts the ball into the other direction and always scores.
All, except one, of Chelsea’s first six penalties were struck to Van der Sar’s left by right footed players – the exception being the left footed Ashley Cole who struck to his stronger side, which was still Van der Sar’s left side. John Terry however, slipped and missed his penalty even though Van der Sar was beaten. Cristiano Roanldo also did exactly as the Chelsea players were told. He stuttered at his run up to try and get Chelsea keeper Petr Cech to dive early. But the Czech keeper, perhaps aware of Ronaldo’s tactics, stood his ground calmly. Ronaldo indeed put the ball to his natural side and Cech dived to his right to save. All was working well for Chelsea, but when Nicolas Anelka stepped up, game theory backfired on Ignacio and Chelsea.
Van der Sar became wise to Chelsea’s tactics of striking the ball to his left. So far he had dived incorrectly to his right (the natural side for a right footed penalty taker) 4 out of 6 times. But as Anelka stepped up, Van der Sar pointed to his left side as if to say he knew where Anelka was going to try and put the ball. Anelka saw it and probably panicked at the thought that the Dutch goalkeeper knew his tactics. Now his decision was to either stick with his tactic or change it since Van der Sar knew. But he also knew that Van der Sar knew he would try to change his tactic. Nevertheless Anelka did change his tactic and go to the right of the keeper and the penalty was saved – United winning the Champions League.
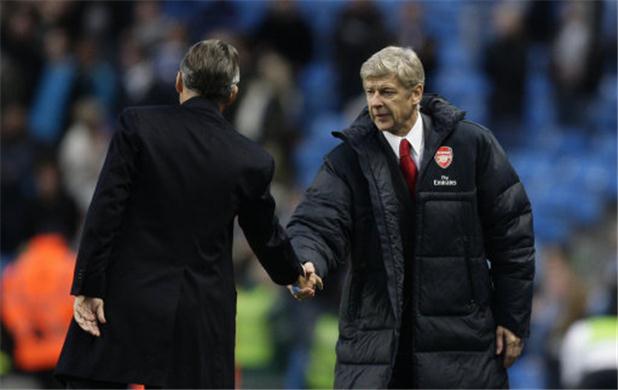
From these rustic examples of studying game data and trying to influence decisions on the pitch to more sophisticated means of capturing events at a game, statistics in football have grown a long way. Events from the game like passes completed, kilometres run, interceptions, key passes made, sprints run during a game, all contribute to helping managers make better decisions to out-think their opponents. Some managers are more trusting of statistics than others. Manchester United under Sir Alex Ferguson humoured statisticians more than other clubs but they still were relegated to the background in spite of meeting with Ferguson occasionally. Arsene Wenger at Arsenal loves his number, being an economist himself, and he was one of the first to embrace statistics in a big way. They say after a game, he would sit with his spreadsheets and go over each and every detail of the game and draw his conclusions. One such conclusion was that roughly 99% of shots from outside the box do not result in a goal. Perhaps this is one of the reasons his Arsenal team rarely ever shoots from outside the box.
Wenger even used accurate statistics to find his players. When he was looking for a replacement for Patrick Vieira, he identified the key aspects of Vieira’s game that he wanted in his replacement. The most important characteristic was the distance run during a game. When he searched for this data in Europe, he found that an unknown teenager called Mathieu Flamini from Marseille ran 14 kilometres on average every game. He signed Flamini for next to nothing. Flamini went on to play for Milan and is now back at Arsenal. Denis Bergkamp at Arsenal too admitted to be used for Wenger’s statistical analysis regularly. David Moyes is also an example of a stat-happy manager. At Everton, he would have the stat team across his office and would consult them regularly.

A statistical oversight caused Real Madrid in 2003 to lose Claude Makelele to Chelsea. When he was sold, club president Florentino Perez said the Frenchman won’t be missed.
We will not miss Mak lel . His technique is average, he lacks the speed and skill to take the ball past opponents, and ninety percent of his distribution either goes backwards or sideways. He wasn’t a header of the ball and he rarely passed the ball more than three metres. Younger players will arrive who will cause Mak lel to be forgotten.
The important stat Madrid were not looking at was that Makelele did 84% of his high intensity work when the opponent had the ball, twice more than any other player on the pitch. Makelele later had 5 successful years at Chelsea and now has a football position defined as the “Makelele role”.
When Liverpool boss John Henry bought the club in 2010, he wanted stats to dictate his strategy, as would any businessman. Enter Damien Comolli, a Frenchman with an affinity for numbers. Comolli was a football scout at Arsenal and was responsible for unearthing Kolo Toure, Emmanuel Eboue and Gael Clichy. Then at Spurs, from 2005 to 2008, at Comolli’s insistence, the club signed young players like Gareth Bale, Kevin Prince-Boateng, Adel Taraabt and Younes Kaboul, as well as first team players Luka Modric, David Bentley, Heurelho Gomes and Dimitar Berbatov. For Comolli, the stats added up enough to sign these players.
At Liverpool, Comolli again went to the stats to influence the decisions to buy Andy Carroll and Luis Suarez on deadline day in the January 2011 transfer window. Comolli’s stats drove him to believe that Carroll, along with Stewart Downing, who was signed next season, would be an unbeatable partnership as Downing was statistically the best crosser of the ball in the Premier League. However, this strategy backfired miserably, which goes to show that statistics can only be a substitute and not the primary parameter to influence decisions and also, that statistics taken in the right context alone are helpful. Downing’s crosses were key in creating chances for Aston Villa the previous season, but they were mostly crosses from dead-ball scenarios. Liverpool just did not create that many dead-ball situations.
Another example of the right context is the kilometres covered during a game. There is no direct co-relation between kilometres covered and games won by a team, but there is one between the number of sprints run and games won. Just like stats on key passes (passes that lead to goal-scoring opportunities) give a more accurate picture of how passing affects the outcome of a football match than just the normal pass completion percentage. Statistics in football has evolved over recent years, but a lot more needs to be done to get perspective on how to study the millions of data points available in a football match. Steps have been taken in the right direction with modern managers embracing statistics, but a lot needs to be researched before stats can effectively influence decisions in football.